
Studies with Liv.52 in the Treatment of Infective Hepatitis, Chronic Active Hepatitis and Cirrhosis of the Liver
Prof. Mandal, J.N., M.B. (Cal.), D.C.H. (Lond.), F.R.C.P. (Edin.), Professor - Director
and Roy, B.K., M.D. (Cal.), Senior House Physician to Professor-Director, Department of Medicine, Medical College and Hospital, Calcutta, India.
Liv.52 in chronic active hepatitis and cirrhosis
| No improvement could be achieved in 12.5% of cases in the Liv.52 Group, even after following up the cases for 36 months, whereas 50% of cases in Control Group failed to improve; rather many of them deteriorated in the same period. 2. Biochemical: (i) Serum bilirubin: Table XI and Annexure III depict the trend of changes in Serum bilirubin in the 2 groups. It was observed that in 9 cases of Liv.52 Group, Serum bilirubin began to decrease very early and the levels came down to normal or near normal in 6 months’ time, whereas no case in Control Group showed any such improvement within that period. |
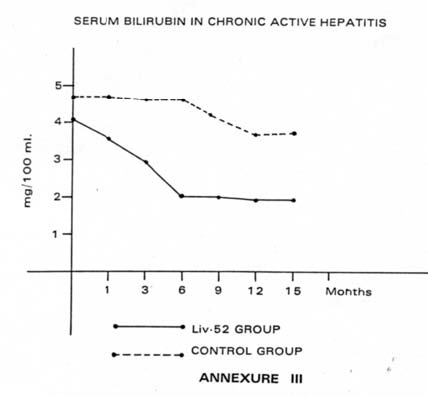 |
| Table XI: Serum bilirubin in chronic active hepatitis (in mg/100 ml) | |||||||
| On admission | 1st month | 3rd month | 6th month | 9th month | 12th month | 15th month | |
| Liv.52 group (Mean: 24 cases) | 4.1 | 3.6 | 2.9 | 2.2 | 2.6 | 1.9 | 1.9 |
| Control group (Mean: 8 cases) | 4.7 | 4.7 | 4.6 | 4.6 | 4.2 | 3.9 | 4.0 |
Three cases out of 24 patients i.e. 12.5% in Liv.52 Group, Serum bilirubin showed no improvement, rather the levels increased, whereas in Control Group 4 cases out of 8 patients (i.e. 50%) showed no improvement and became worse.
| (ii) Alkaline Phosphatase: Table XII and Annexure IV depict the trend of changes in Alkaline phosphatase in the Liv.52 Group and Control Group of Chronic Active Hepatitis. It was observed that in 9 cases of the Liv.52 Group, there was an early improvement in the values of Alkaline phosphatase which became normal in 6 months whereas no such improvement was observed in any case of Control Group within that period. Twelve other Liv.52-treated cases showed moderate improvement and their values became normal in 12 months’ time. The values remained normal during the period of the next 12 months also, with only half the dose of Liv.52 i.e. 6 tablets daily in 3 equal doses, whereas 4 cases out of the 8 patients in Control Group showed only some improvement during the same period. |
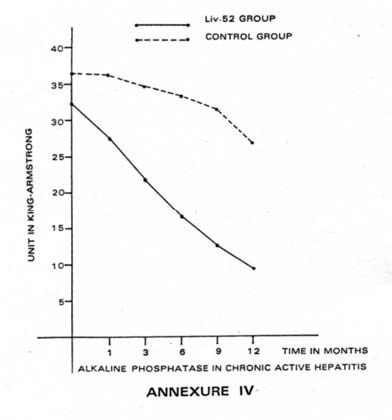 |

| Table XII: Alkaline phosphatase in chronic active hepatitis (in King Armstrong Units) | ||||||
| On admission | 1st month | 3rd month | 6th month | 9th month | 12th month | |
| Liv.52 group (Mean: 24 cases) | 32.5 | 27.4 | 21.9 | 16.6 | 12.6 | 9.4 |
| Control group (Mean: 8 cases) | 36.4 | 36.1 | 34.9 | 33.2 | 31.6 | 26.7 |
| (Normal: 4-13 units) | ||||||
Twelve other Liv.52-treated cases showed moderate improvement and their values became normal in 12 months’ time. The values remained normal during the period of the next 12 months also, with only half the dose of Liv.52 i.e. 6 tablets daily in 3 equal doses, whereas 4 cases out of the 8 patients in Control Group showed only some improvement during the same period.
Three cases out of the 24 Liv.52-treated cases and 4 out of 8 Control cases failed to show any improvement in Serum alkaline phosphatase values, even after 36 months.
(iii) Serum Total Protein/Albumin: Globulin: The trend of changes in Serum Total Protein/Albumin: Globulin is depicted in Table XIII.
| Table XIII: Serum total protein, Albumin : Globulin in chronic active hepatitis | |||||||||||||||||||||
| On admn. | 1st month | 3rd month | 6th month | 9th month | 12th month | ||||||||||||||||
| TP | A | G | TP | A | G | TP | A | G | TP | A | G | TP | A | G | TP | A | G | ||||
| Liv.52 group (Mean: 24 cases) | 6.2 | 2.8 | 3.4 | 6.2 | 2.9 | 3.3 | 6.3 | 3.3 | 3.0 | 6.4 | 3.6 | 2.8 | 6.4 | 3.6 | 2.8 | 6.4 | 4.0 | 2.4 | |||
| Control group (Mean: 8 cases) | 5.9 | 2.4 | 3.5 | 5.9 | 2.1 | 3.8 | 5.9 | 2.0 | 3.9 | 5.9 | 2.1 | 3.8 | 6.0 | 2.4 | 3.6 | 6.1 | 2.7 | 3.4 | |||
| The observations on albumin and globulin in Chronic Active Hepatitis are summarised in Table XIV. | |||||||||||||||||||||
| Table XIV: Albumin : Globulin | |||||
| No. of cases improved in 6 months | No. of cases improved in 12 months | No. of cases not improved after 36 months | No. of cases significantly improved in 6-12 months | No improvement | |
| Liv.52 group (Mean: 24 cases) | 9 (37.5%) | 12 (50%) | 3 (12.5%) | 21 (87.5%) | 3 (12.5%) |
| Control Group (Mean: 8 cases) | 0 (0%) | 4 (50%) | 4 (50%) | – | – |
(iv) Serum GOT and GPT: The trend of changes in SGOT and SGPT is depicted in Table XV.
| Table XV: SGOT/SGPT in chronic active hepatitis | ||||||||||||||||||||||||
| On admn. | 1st month | 3rd month | 6th month | 9th month | 12th month | |||||||||||||||||||
| GOT | GPT | GOT | GPT | GOT | GPT | GOT | GPT | GOT | GPT | GOT | GPT | |||||||||||||
| Liv.52 group (Mean: 24 cases) | 73.79 | 118.5 | 70.4 | 115.4 | 64.2 | 104.1 | 47.1 | 74.6 | 40.0 | 65.3 | 23.2 | 37.5 | ||||||||||||
| Control group (Mean: 8 cases) | 69.8 | 130.2 | 81.2 | 127.8 | 80.8 | 126.5 | 75.6 | 123.3 | 67.0 | 111.6 | 51.7 | 80.3 | ||||||||||||
It was observed that 21 out of 24 patients (87.5%) on Liv.52 showed total improvement in respect of SGOT/SGPT results in 12 months’ time, as against a slight improvement in 4 out of 8 cases of the Control Group during the same time.
It was noteworthy that GOT/GPT reverted to normal in only 6 months’ time in 9 out of 24 patients (37.5%) in the Liv.52 Group against NIL in the Control Group.
(v) BSP Study: There had been marked clearance in BSP in all the 5 cases of Liv.52 Group in 12 months’ time as against only one case in the Control Group.
(vi) Protein Electrophoresis: Quantitative immunoglobulin determination by Electro-phoresis method revealed an elevation of all types with a marked increase in IgG at the initial 1st and 2nd investigations on admission and after 6 months respectively, both in Liv.52 Group and Control Group. But on subsequent investigations at 9th and 12th months, 21 patients (87.5%) of the Liv.52 Group showed almost normal range of immunoglobulins with a slightly higher level of IgG, whereas in the Control Group, only 4 out of 8 (50%) patients showed a similar improvement.
(vii) Histopathological Investigation: Nine cases (37.5%) in Liv.52 Group showed marked improvement in respect of regeneration and repair of liver cells in 6 months’ time, whereas none in the Control Group showed any significant improvement during the same period.
However, in 12 months’ time regressive changes in respect of liver cell damage were observed in 12 cases (50%) and 4 cases (50%) of the Liv.52 and Control Groups respectively.
Three cases (12.5%) of the Liv.52 Group showed no improvement of liver cell pathology, rather they became worse, in spite of intensive therapy (12 tablets of Liv.52 daily for 3 years). Two patients out of these 3 were HBsAg +ve. Four patients (50%) of the Control Group failed to improve histopathologically, ultimately attaining a picture of cirrhosis.
Copyrights © 2009 healthyliver.co.uk